This tutorial explains how to change the position of a single legend.
If you wish to reorder the layout of multiple legends, check here instead.
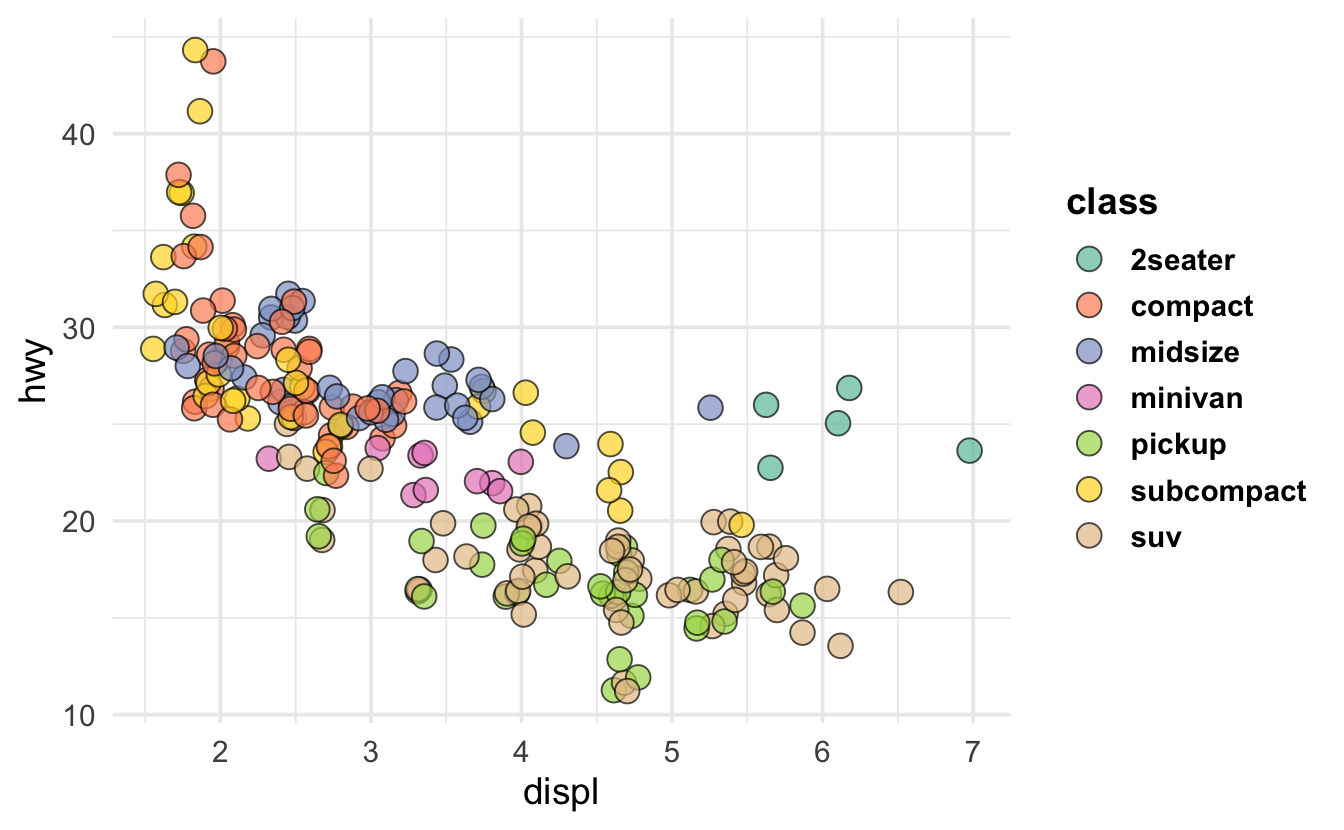
Create a scatterplot with a legend
# packages library(ggplot2)library(dplyr) # set the default global themetheme_set(theme_minimal(base_size =14) +theme(# bold the legend title and labelslegend.title =element_text(face ="bold"),legend.text =element_text(face ="bold"))) # create a scatterplotp <- mpg %>%ggplot(aes(displ, hwy, fill = class)) +geom_point(position =position_jitter(.1, 1, 1), shape =21, size =4, alpha = .7) +scale_fill_brewer(palette ="Set2")p
Relocate legend to the plot bottom
Optional values are right (default), top, left, and bottom. Once the legend is positioned to the bottom, it automatically takes a horizontal orientation.
p +theme(legend.position ="bottom")
Relocate legend anywhere desired
Alternatively, use a pair of coordinate values in the range of [0, 1] to specify the legend central position relative to the range of the plot.
# relocate legend to 70% of plot width, 75% of plot heightp2 <- p +theme(legend.position =c(.7, .75)) p2
Turn legend keys into 3 rows
The guides() function is a powerful tool to customize non-data related appearance of scales (including legends and axes). In this tutorial, as the legend is associated with the fill aesthetic, fill = ... is used inside the guides() function.
p2 +guides(fill =guide_legend(nrow =3))
The guides syntax can be equivalently written inside the associated scale_* function. (The new scale_fill_brewer() overwrites the earlier one, and prompts a message reminder in the console.)