# packages and global themelibrary(ggplot2)library(dplyr)
theme_set(theme_bw(base_size = 14) + theme( # make x-axis label and title more prominent axis.text.x = element_text(color = "turquoise4", face = "bold"), axis.title.x = element_text(color = "tomato3", face = "bold")))Complete Guides on Reordering Graphic Elements in ggplot2 - Crash Course on Bar Rearrangement with 4 Different Methods
Reordering graphical elements in a commonly performed and critical technique in data visualization (as highlighted in this inspiring example), but can be also a confusing procedure for beginners. This serial tutorials on reordering start by explaining in this article how to rearrange a bar plot using four distinct approaches.
The techniques introduced here are broadly applicable to reorder other graphical elements, which are covered in these following articles:
- Reorder violin plots based on group statistics
- Reorder faceted panels (subplots)
- Reorder stacking order of bars and ribbons
Start with a toy example
In the following plot, the bars are arranged in the alphabetical order of the level names of the course variable. Arranging in alphabetical order is the default for character variables in ggplot2.
course <- c("math", "English", "physics", "music", "gym") scores = c(58, 90, 65, 87, 120)t <- tibble(course = course, scores = scores)
t %>% ggplot(aes(course, scores)) +  geom_col(fill = "snow3")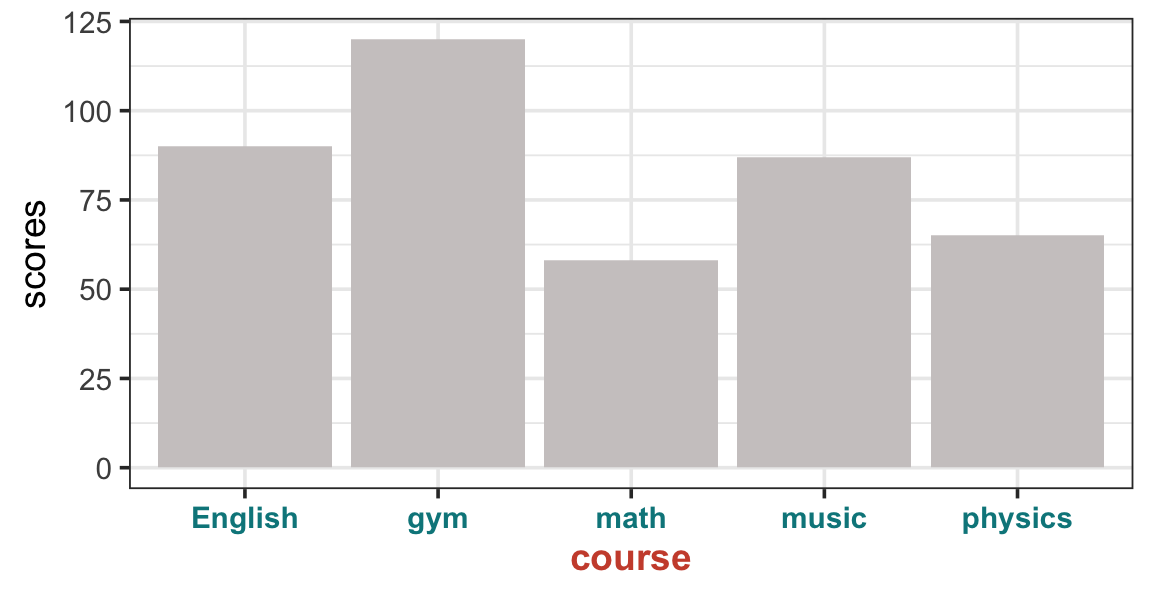
Rearrange the bar order
To rearrange the bar order, e.g., by descending order of course scores, a generic approach is to turn the course variable to a factor with specified level order. A factor has two types, a nominal or unordered factor (fct), and ordered factor (ord), and both types work the same regarding reordering graphics in ggplot2. The following approaches will generate nominal factors, unless otherwise specified.
Method 1: Use base R reorder()
Use base R function reorder() to turn course to a factor (fct) based on the associated scores. The descending order is specified by the minus sign -; alternatively, you can use the desc() function from the dplyr package, e.g., desc(scores).
t %>% mutate(course = reorder(course, -scores)) %>% ggplot(aes(course, scores)) + geom_col(fill = "snow3")
You can simplify the code by updating the course variable directly in the aesthetics in the ggplot() function.
t %>% ggplot(aes(reorder(course, -scores), scores)) + geom_col(fill = "snow3") 
This approach however changes the x axis title to “reorder(course, -scores)”. You can easily fix this by adding + labs(x = "course") at the end of the script.
Method 2: Use the forcats package
forcats is a versatile package for factor manipulation, and fct_reorder() updates the factor level order in a syntax similar to the base R reorder() function. Either the minus sign or desc() can be used to dictate the descending order.
library(forcats)t %>% mutate(course = fct_reorder(course, desc(scores))) %>% ggplot(aes(course, scores)) + geom_col(fill = "snow3")In like manner, you can do the factor conversion directly in the aesthetics as below.
t %>% ggplot(aes(fct_reorder(course, -scores), scores)) + geom_col(fill = "snow3") + labs(x = "course")Method 3: Use the dplyr approach
You can use the arrange() function from dplyr package to first rearrange the rows, and then convert the course variable to a factor using the mutate() and the base R factor() function.
t %>% arrange(-(scores)) %>% mutate(course = factor(course, levels = course)) %>% ggplot(aes(course, scores)) + geom_col(fill = "snow3")Two important points to remember:
Simply rearranging the rows with
arrange()is not enough to create an ordered bar plot, ascourseremains acharactervariable by this step, and has no “memory” of the order of the course names. It needs to be explicitly converted to a factor to “memorize” the course order.Values fed to the
levelsargument must not contain duplicated levels. If there was duplicated course names, use theunique()function to extract distinct levels, e.g.,levels = unique(course).
Method 4: Manually specify the order of factor levels
Suppose that you want to rearrange the bars in a particular order as shown in the code below. You can achieve this in two ways.
# specify the desired order to be displayedmy_order <- c("math", "music", "gym", "English","physics")- Option 1: Apply the aforementioned method 3, except that this time it is the vector
my_orderthat is fed to thelevelsargument. Check this example where the same technique is applied to arrange faceted subplots in the specified order to make informative visualization.
t %>% mutate(course = factor(course, levels = my_order)) %>% ggplot(aes(course, scores)) + geom_col(fill = "snow3")- Option 2: Use
scale_x_discrete()to manipulate the plot itself. This approach does not change the underlying data input.
t %>% ggplot(aes(course, scores)) + geom_col(fill = "snow3") + scale_x_discrete(limits = my_order)Continue Learning — 🚀 one level up!
In the above demonstrations, each course name has a single score, and each row corresponds to a single bar. When each course has multiple scores, or more broadly when each categorical level corresponds to multiple rows (observations), you can use the same technique to reorder the factor levels but based on group statistics – learn more how to reorder violin plots based on different summary statistics.
In addition, check out the following tutorials to further enhance your mastery on ordering customization:
- reorder faceted panels (subplots)
- reorder the stacking of bars and ribbons. An excellent example illustrating of the power of stacking reordering can be found in the following stacked area / alluvial plot, which clusters ribbons (countries) of the same continent, and uses color gradients to distinguish countries and continents.


