Remove Legend Components in Three Distinct Ways in ggplot2
In ggplot2, the legend generation follows such a basic rule: (1) each geom_* is mirrored as a glyph element in the legend, and (2) each aesthetic is reflected by its own legend. As such, this tutorial explains:
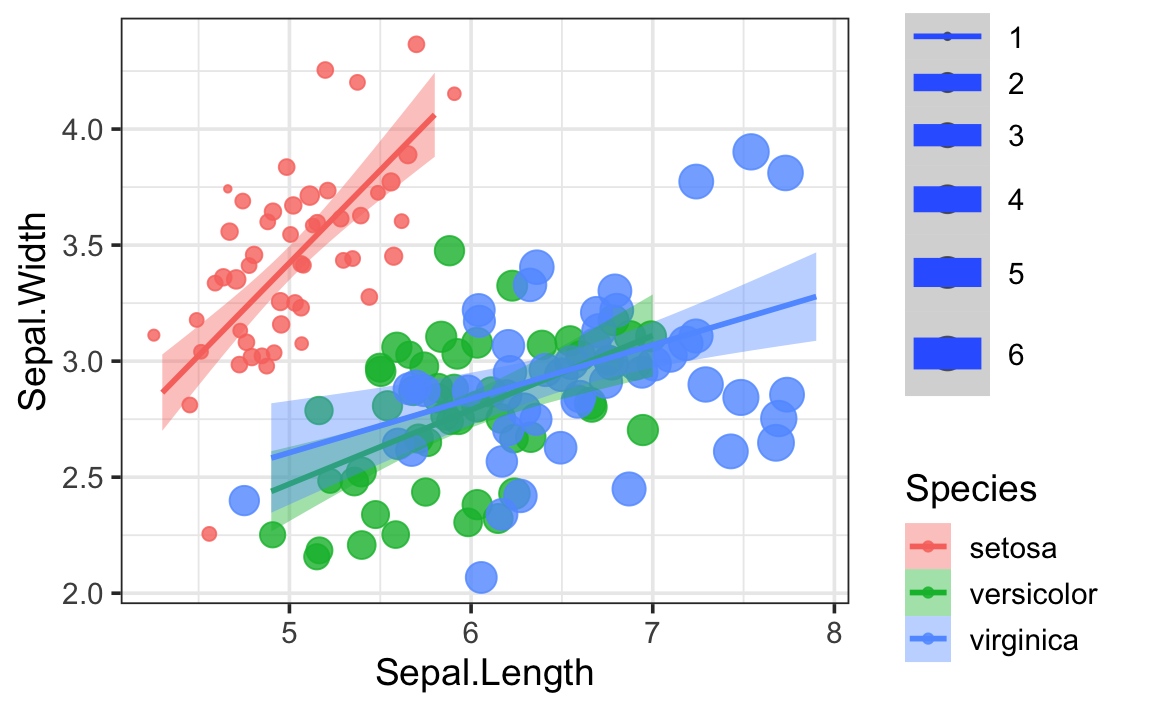
# packages library(ggplot2)library(dplyr) # set default global themetheme_set(theme_bw(base_size =14)) # create a scatterplotp.point <- iris %>%ggplot(aes(x = Sepal.Length, y = Sepal.Width, color = Species, fill = Species, size = Petal.Length)) +geom_point(position =position_jitter(.2, .2, 1), alpha = .8) # add regression line# the warning message (not displayed here) can be safely ignoredp.point.smooth <- p.point +geom_smooth(method ="lm") p.point.smooth
Remove the glyph element associated with a geom_*
Each geom_* is mirrored as a glyph element in the legend. The geom_smooth() creates regression lines and confidence ribbons, which are correspondingly reflected as the line and ribbon elements in the legend keys, respectively. These two glyph elements in the legend can be removed by setting show.legend = F in geom_smooth().
In the plot above, the only remaining legend glyph, the circular points, comes from geom_point(). These two legends reflect the two aesthetics of size and color. If show.legend = F is specified in both geom_point() and geom_smooth(), then all legends will be removed from the plot.
Remove the legend associated with an aesthetic
Each aesthetic has its own legend, which can be individually customized or removed with the guides() function. The script below removes the legend of the size aesthetic.
p.point.smooth +guides(size ="none")
Equivalently, the guides() can be written inside its associated scale() function.
# use 'guide' without the plural "s"p.point.smooth +scale_size_continuous(guide ="none")