# packages library(ggplot2)library(dplyr)
# set the default global themetheme_set(theme_bw(base_size = 14) + theme( legend.title = element_text( face = "bold", size = 16, color = "turquoise3")))Rename Legend and Axial Titles by Three Methods in ggplot2
This tutorial explains how to rename legend titles. You can use the same technique to rename x and y-axis titles. (Check here if you wish to remove legend titles)
Packages, dataset, and mistitled plot
Here we use the ToothGrowth dataset (of base R) for demonstration.
# convert to tibble for easier dataset navigationToothGrowth <- as_tibble(ToothGrowth)head(ToothGrowth, 3)Output:
# A tibble: 3 × 3
len supp dose
<dbl> <fct> <dbl>
1 4.2 VC 0.5
2 11.5 VC 0.5
3 7.3 VC 0.5
In the following boxplot, the dose variable is mapped to fill aesthetic. As dose is a continuous variable, we wrap it in factor() to convert it to a categorical variable. This edit turns the otherwise continuous colorbar into a discrete legend, which fits better to depict three discrete doses. This, however, also changes the legend title to “factor(dose)”. The following tutorial explains how to rename the legend title as “dose”.
# create a boxplot with a not-so-pretty legend titlep <- ToothGrowth %>% ggplot(aes(x = supp, y = len, fill = factor(dose))) + geom_boxplot() p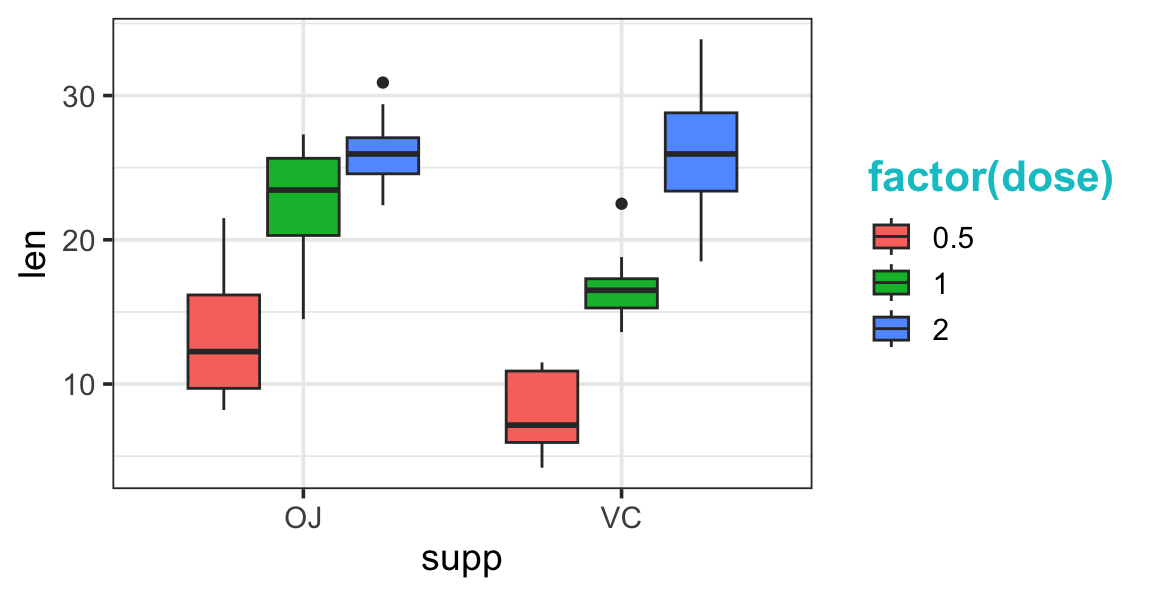
Method 1: Rename with labs()
labs() is a quick approach to change axial and legend titles. As the legend is associated with the fill aesthetic, we use fill = ... to change the associated title.
p + labs(fill = "dose")
Side note: fill refers to the filled color of the interior of a shape, while color refers to the outline of a shape. In geom_point(), the use of color and fill depends on the associated shape. Check here to learn more.
Method 2: Rename with scale_*
Each aesthetic has its own legend, and the associated scale. As fill is mapped with a categorical variable factor(dose), it corresponds to the scale of scale_fill_discrete(). If fill is associated with a continuous variable, it corresponds to scale_fill_continuous().
p + scale_fill_discrete(name = "dose")The color and fill scales are often associated with a color palette. The following fill scale employs the brewer palette and viridis palette while updating the legend title to “dose”.
p1 <- p +   scale_fill_brewer(palette = "Pastel2", name = "dose")
p2 <- p +   scale_fill_viridis_d(option = "A", name = "dose")
library(patchwork)p1 | p2
Method 3: Rename with guides()
guides() is a powerful tool to customize non-data related appearance of axes and legends.
If the legend is associated with a discrete variable, use syntax
guide_legend().If a numeric variable is mapped to
colororfillto generate a continuous colorbar in the legend, useguide_colorbar()instead. This differentiation of “legend” and “colorbar” terminology only exists in theguides()function. Intheme(), both colorbar and legends are known as the “legend”.For axis, use
guide_axis().
The guides syntax can be written in the following two equivalent forms.
p + guides(fill = guide_legend(title = "dose"))
# use "guide = ", without the plural "s"p + scale_fill_discrete(guide = guide_legend(title = "dose"))
